

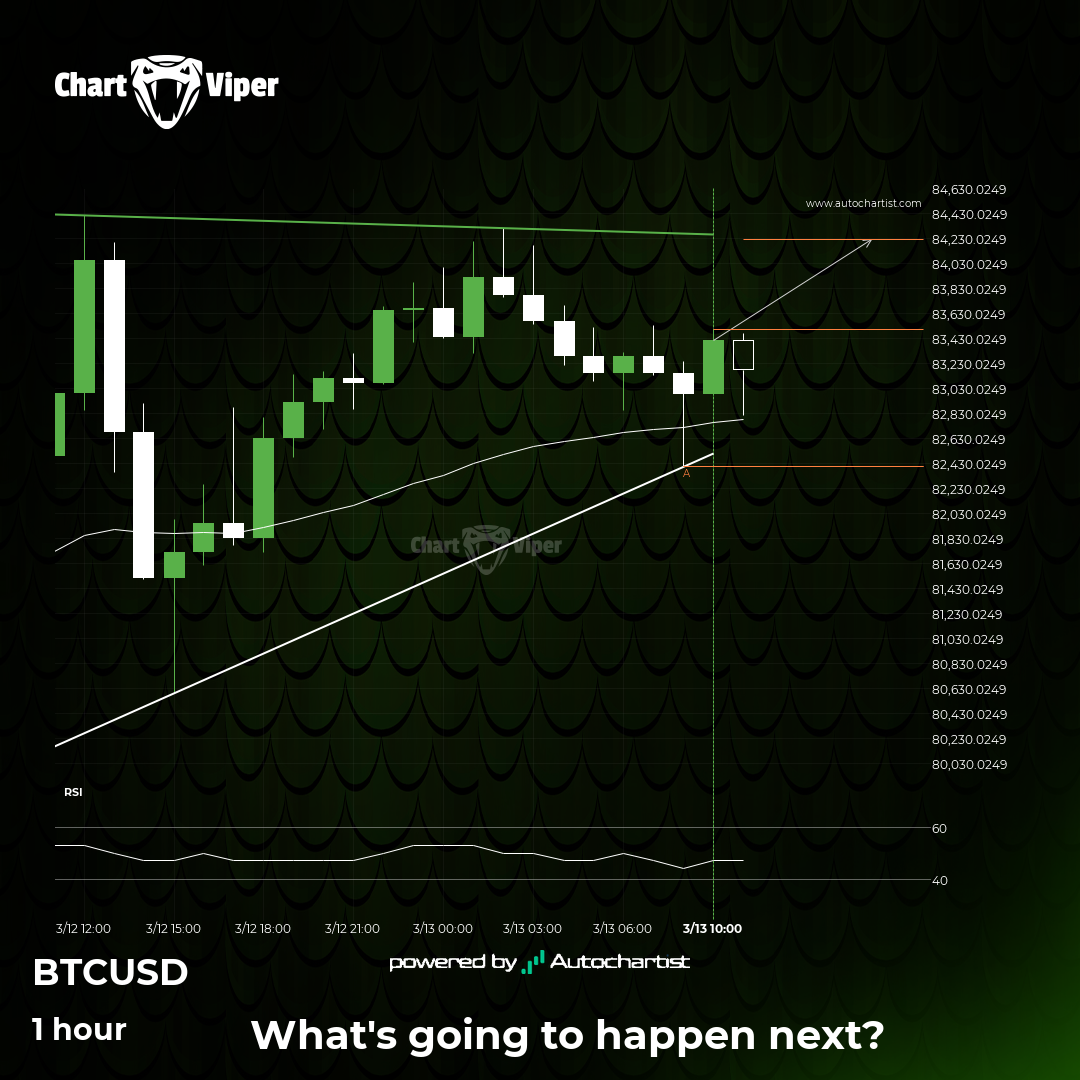
Bitcoin was identified at around 83499.6 having recently rebounded of the support on the 1 hour data interval. Ultimately, the price action of the stock has formed a Ascending Triangle pattern. This squeeze may increases the chances of a strong breakout. The projected movement will potentially take the price to around the 84217.1650 level.

Take your trading game to the next level with our comprehensive Autochartist subscription Options
Why Subscribe?
- Access Exclusive Web Content: Gain unlimited access to our extensive Research Portal, Technical Analysis, Volatility Analysis, Event Impact Analysis, and more!
- Receive Premium Email Content: Elevate your trading strategy with our comprehensive suite of email reports covering Forex, Crypto, Index, Futures, Stocks, and Correlating Alerts.
- Utilize MetaTrader Tools: Seamlessly integrate Autochartist Market Scanner, Risk Calculator, and Volatility Analysis directly into your MetaTrader platform.
- Explore Additional Features: Stay informed on-the-go with the Autochartist Mobile App, receive selected Telegram Alerts, and never miss a market event with our comprehensive calendar.
Upgrade Now and Take Control of Your Trading Journey!
Don’t settle for limited insights. Join our community of successful traders and unlock the full potential of Autochartist.
Click here to select an Autochartist Subscription Option
Got questions? Contact our support team for assistance.